Common Core State Standard:
1.MD.4
Measurement and Data
Represent
and interpret data
Organize, represent, and interpret data
with up to three categories; ask and answer questions about the total number of
data points, how many in each category, and how many more or less are in one
category than in another.
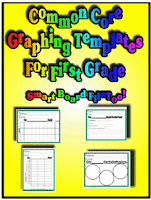
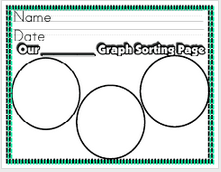
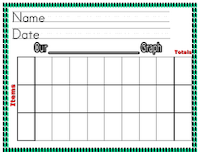
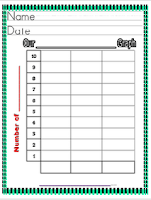
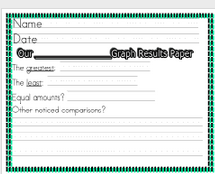
We needed an easy way to collect, manage, and display data for our first graders. We came up with the following templates. They can be printed and changed to use as student tools for learning. Once they learn the format and process of using these graphs, you can filter new information and content right through them. They can be used for homework, math centers, small group, and independent use. There is also a Smart Board File to model the techniques of collecting, organizing, and interpreting data. It can also be used as a whole group data collection template. These graphs can be used over and over again. Students love them and take ownership over their learning. Check them out!
Hard copies - printable pdf files
Smart Board File - with directions on how to edit




No comments:
Post a Comment